Editor’s Note: Mark Gardner, NBCT, is a high school English teacher in southwest Washington state working in a hybrid role that also allows him to work on professional development experiences for teachers. The views expressed in this blog are his own.
I am not afraid of numbers.
Yes, I teach high school English, but was raised by a math teacher, found calculus comfortably challenging, and rather enjoy the cognitive acrobatics of math.
Yet viewing my students as numbers — as mere data points — was something I struggled with for years. Each fall when the spring’s test data rolled in, I’d peruse the data from my previous year’s students. By then, the kids had moved on to another teacher, and whether they passed or didn’t pass this test (a graduation requirement) did little to help me make any kind of instructional decisions. Still, this was the data that I felt I was supposed to be analyzing.
Further complicating my view of data: early in my career at staff training, my colleagues and I were sent to the cafeteria to design a common test so we could “gather student data.” Ever compliant, we pulled together a short, easy-to-grade test that we each grudgingly agreed to wedge into our classes in sometime in the first six weeks. It was inauthentic and disconnected from what we were actually teaching. None of us could envision how this overly-simple, decontextualized test was doing any more than just giving us a list of numbers we could use to satisfy our bosses. The sole purpose was to gather data so we could deliver that data to someone else. Thus, the start of my relationship with classroom data was not a good one.
Then in 2010, our state legislature passed a new teacher evaluation law. While imperfect, it does include this requirement: teacher evaluations must include our impact on student growth, and this growth must reference data from at least two points in time, from state-, district- or classroom-based assessments. At this point, I was not teaching courses tested by state- or district-based assessments, so I was left to figure it out on my own.
That autonomy changed how I thought about data. Before I knew it, this happened:
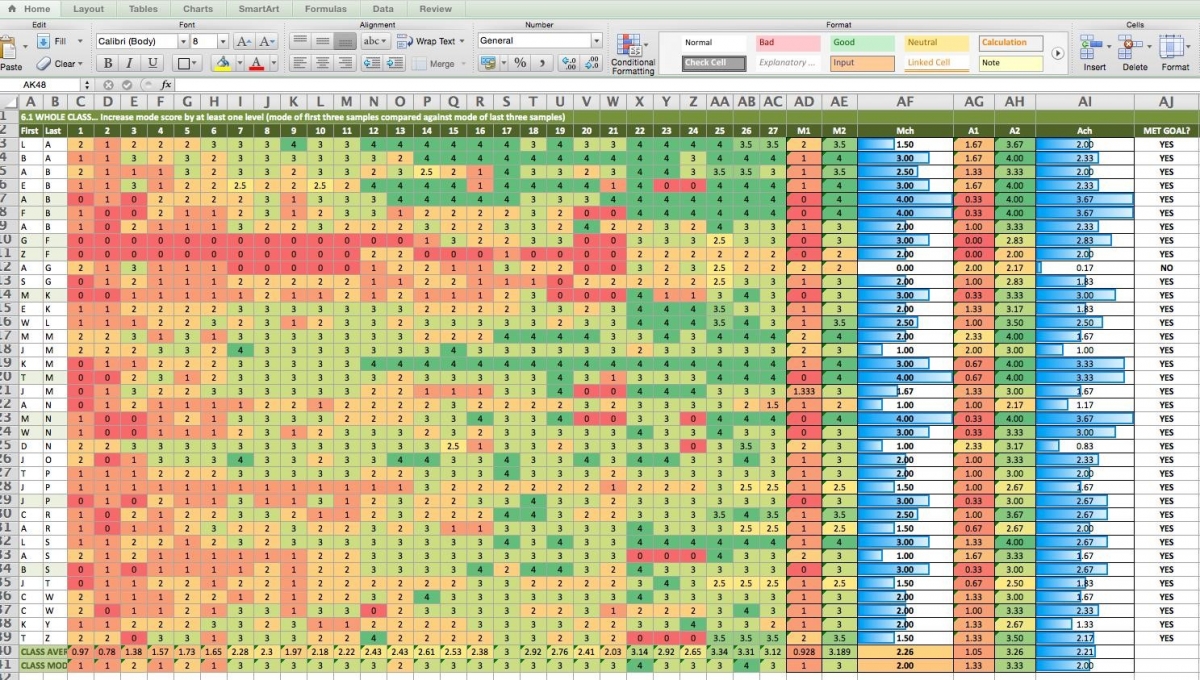
This spreadsheet, however, came at the end of my process. At the start of it all, I began by thinking about data not from a mathematical perspective, but from a language perspective – the word’s etymology. The word data, it turned out, didn’t mean what I thought. It is from Latin meaning “something given in order to form the basis for reasoning or inference.”
A light bulb: What do my students give me?
When I considered what my students did in class, I realized that I had them writing all the time. We wrote literary analysis, research pieces, opinions, reflections…the list continued, but in each type of writing, I always expected clarity of claims and detailed support.
Previously, reams of state test data and contrived assessments had formed my negative perception of data. Now, though, instead of focusing on gathering numbers, I realized I needed to focus on what my students gave me: What information about their learning was provided each time they wrote?
After years of teaching freshman English, I could easily predict the characteristics of the writing my students give me in September. Likewise, I knew from these same years of experience what they would give me in June. I had never really stopped to think about what made good writing in September different from good writing in June — and further, I had never really taken a close enough look at I actually did, step by step, between September and June to make that transformation happen.
From there, I designed a continuum of “what students typically give” from September through June in terms of four specific qualities of their writing. This continuum eventually was simplified into a student-friendly proficiency scale. I used this scale with my students to give them feedback as well as to help them understand their own progress. Those scores are what populate the colorful chart above, the transition from red through orange and into green further helping illustrate my students’ progress on that continuum.
As I tracked their progress, I was able to notice when we were stalling on a skill or when individuals needed specific supports to move forward. I could be more responsive to specific needs, those step by step moves I made between September and June became deliberate and powerful. This happened because the data I used was authentic, meaningful and classroom-based.
I’ve learned not to think of classroom data as numbers, even though I am swimming in numbers. I was swimming in numbers before, holding those reams of state test results. I was producing numbers before as well, with those meaningless and low-cognitive-demand-but-easy-to-score common assessments we shoehorned into our sequence for the sake of gathering numbers. Now, the numbers mean something because they represent my thoughtful assessment of what my students have given me. Just as important, they reflect what I need to give them in return.